Grafana Labs unveiled a set of Grafana Cloud updates at ObservabilityCON 2026 on October 20, framing them as agentic operations. SiliconANGLE's Mike Wheatley reported the announcements.
The new agents
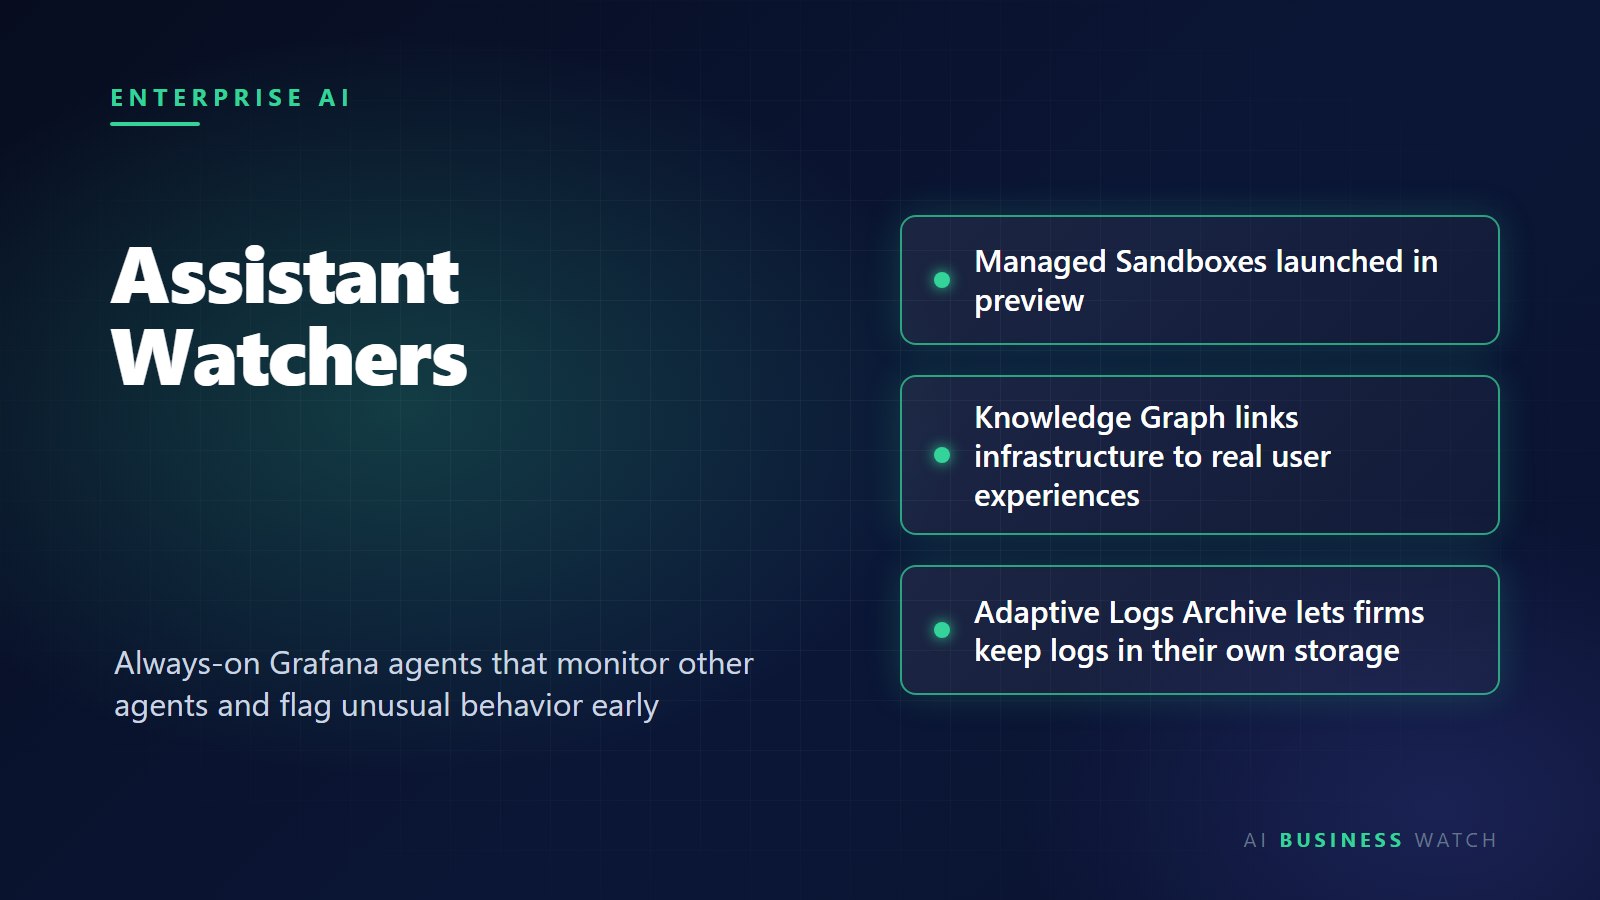
Assistant Watchers are always-on agents that monitor other agents and flag unusual behavior early. Grafana Cloud Agents are aimed at remediating problems. The article does not state the availability status of either. Grafana Managed Sandboxes launched in preview and offer a controlled environment where AI reviews code against production behavior and prepares software fixes for human review. Mat Ryer, Grafana's senior director of AI, said: “Together they make Grafana Cloud more autonomous,” and added that enterprises need evidence and control at each step when AI agents take on more work.
Context and visualization
A Knowledge Graph and Digital Experience Monitoring connect infrastructure and application dependencies with real user experiences, giving AI agents and engineers a shared runtime context, and Mobile Observability and Session Replay complement them. A feature called Pages lets teams build customized, app-like visualizations of AI workloads. Richard Lam, Grafana's director of product, argued: “Most teams do not have a monitoring problem.” In his view the real challenge is telemetry from every layer with no way to connect it to affected customers.
Logs and cost
Grafana Cloud Logs gains query performance improvements built on technology from the Logline acquisition, speeding full-text search across low-frequency data such as request IDs at no additional cost. Adaptive Logs Archive, part of the Adaptive Telemetry Suite, lets enterprises send logs to their own object storage buckets in open formats to retain data more cheaply.
What is missing
The article includes no pricing, customer counts or other numerical metrics, and several of the features are not described as generally available.
Source: SiliconANGLE. This is an AI Business Watch summary of the original report.